Get a free study
Menu

zPulse · by Technical Storage

z/OS storage studies, in one application

zPulse reads the RMF and CMF reports, DCOLLECT extracts, tape catalogues and VEHSTATS files you already produce, on your own server. One application replaces EADM, EATM, EAMC and 18 ControlCenter tools, and a daily mail is waiting before the morning meeting.

tools for reports and folders
25
Report Families for the daily mail
6
of history in the DASD and CPU mail charts
60 days
agent to install on z/OS
0

Guided tour · 2:24 · with sound

Read a study the way a z/OS engineer does.

Six real zPulse screens from an anonymised CMF study, explained by a performance engineer: what each chart measures, and what should make you react.

A guided tour of zPulse in six screens2:24 · With sound · SubtitledA z/OS performance engineer walks through six zPulse screens, from Disk Activity to CPU by Workload, and what should make you react on each. Chapters and the full transcript follow the video.
Transcript: A guided tour of zPulse in six screens
  1. 0:00[A data centre in isometric view: disk, CPU and tape cabinets send SMF records to the zPulse block. The zPulse logo appears, by Technical Storage.] This is zPulse, by Technical Storage. Here's how an engineer reads a study.
  2. 0:09Disk Activity. I/O rate in bars, response time split into IOSQ, pending, disconnect and connect, every fifteen minutes. [Disk Activity z/OS, LPAR SYSE. At 00:00, RESP 0.21 ms = IOSQ 0 + PEND 0.06 + DISC 0.04 + CONN 0.11.]
  3. 0:20Peak is just under half a millisecond: amber light. Past one millisecond, it turns red. [Peak RESP about 0.48 ms. Health light: green under 0.4 ms, amber from 0.4 to 1 ms, red from 1 ms.]
  4. 0:27Rising IOSQ: short on aliases. Rising pending: check channels and control units. [Watch for: IOSQ rising, too few PAV aliases. PEND rising, channel or control unit contention.]
  5. 0:35Track Cache Misses. Light red is random, dark red is sequential. Sequential misses during batch are expected. [Track Caches Misses per 15 minutes, normal and sequential; 00:00 to 06:00 highlighted.]
  6. 0:44Random misses that keep climbing mean the cache is losing, and disconnect time follows. [Watch for: random misses climbing, cache under pressure; then DISC time rises with them.]
  7. 0:51I/O Topology Flow traces the physical path: storage group, LCU, SSID, extent pool, rank. Width is intensity, color is response time. [The flow diagram, its five stages labelled, and the legend: under 1 ms, 1 to 3 ms, 3 ms and more.]
  8. 1:04All green here. But three ranks carry three quarters of pool one: that's where hot spots start. [Ranks 0001, 000B and 0003 carry about 75 % of HHJY9 pool 0001. Watch for: a node turning amber or red, a few ranks carrying most of a pool.]
  9. 1:12HyperPAV. Start rate, interrupt rate and IOP busy, the load on your SAPs. [IOP Utilization: I/O start rate, interrupt rate and % IOP busy over the day.]
  10. 1:19At 5 AM, starts jump past seventy thousand a second, and IOP busy follows. If it keeps climbing, or IOSQ appears while aliases are maxed out, resize. [I/O start rate above 70,000 per second at 5 AM, % IOP busy at its peak. Watch for: % IOP busy climbing; IOSQ with aliases maxed out in LCU HyperPAV.]
  11. 1:33CPU Activity: CPU used against the I/O interrupt rate. High CPU, high interrupts: I/O overhead. High CPU, low interrupts: pure compute. Talk to the application team. [00:00 to 01:30: high CPU and high interrupts. Morning: high CPU, lower interrupts.]
  12. 1:50CPU by Workload splits service units by WLM workload. Online owns the day, batch the night. Watch for batch peaks landing in the online window. [Service units stacked by WLM workload; batch peaks at night, online during the day.]
  13. 2:04That's six screens out of thirty-plus. Add hot devices, FICON, R4HA, tape, space and twenty-five tools. [Animation: 6 of the 34 screens of a disk study, then the other modules and 25 tools.]
  14. 2:14Schedule it once: zPulse runs the study and mails the results every morning. [Animation, example output: a schedule at 08:00, zPulse runs the study, three zPulse mails reach the storage team.]
  15. 2:20Get a free study of your own data. technical-storage.com. Trust… but verify.

One app for EADM, EATM, EAMC and 18 ControlCenter tools

Everything EADM, EATM and EAMC did. Now in one place.

Disk, Tape and CPU carry the analyses of EADM, EATM and EAMC. The ControlCenter tools that were ported are listed by name below, each with a link to its card in the catalogue.

From the Technical Storage products to the zPulse modules
BeforeIn zPulseWhat carries over
EADMEasy Analyse Disk MainframeManual and scheduled studies on RMF and CMF reports, the DASD AddInfo and DCOLLECT mails, and the AddInfo tools.
EATMEasy Analyse Tape MainframeTape catalogue studies, the standard report, tape performance and VEHSTATS mails, and the tape tools.
EAMCEasy Analyse Mainframe CheckCPU screens by LPAR, the CPU MSU mail and the TS AddInfo EAMC tool. MIPS views need MIPS files written by EAMC.
  • EADMEasy Analyse Disk Mainframe

    Manual and scheduled studies on RMF and CMF reports, the DASD AddInfo and DCOLLECT mails, and the AddInfo tools.

  • EATMEasy Analyse Tape Mainframe

    Tape catalogue studies, the standard report, tape performance and VEHSTATS mails, and the tape tools.

  • EAMCEasy Analyse Mainframe Check

    CPU screens by LPAR, the CPU MSU mail and the TS AddInfo EAMC tool. MIPS views need MIPS files written by EAMC.

18 ControlCenter tools moved over, and 2 with limits

ControlCenter tools and their zPulse tool
ControlCenter toolzPulse toolModuleReads and notes
TSChannelFICONAnalyzerDiskChannel CSV
TS CFW UtilizationDiskRMF or CMF report
TS CleanerDiskUtility: cleans a CMF or RMF report
TS IO Interrupts % TPIDiskRMF or CMF report
TS.AddInfo (Reader)DiskAddInfo folder, 7 views in one tool
TS.AsyncCacheDiskRMF or CMF report
TS.DcollectDiskAddInfo DCOLLECT files, 6 tabs
TS.FiconMonitoringDiskRMF or CMF report
TS.LcuSsidAssociationDiskRMF or CMF report
TS.OpenExchangeDiskRMF or CMF report
TS.SSIDAnalyzerDiskRead/Write-by-Hour CSV
TS.VolumeDataSharingDiskRMF or CMF report
TS Big Data AnalyzeDiskCompare_Analysis CSV
TS.Analyze426DiskCMF Dataset Activity report only
TS.LparAnonymizerDiskNarrower: CMF and RMF .txt files only
TS.AddInfo.EAMCCPUMSU files; MIPS views need MIPS files from EAMC
TS.TapeAddinfo (V2)TapeTape _Period files
TS.TapeMountAnalyzerTapeRMF or CMF tape report
TS.VehstatsReportsTapeVEHSTATS files, 10 tabs
TS.VirtualTapeIoActivityTapeRMF or CMF tape report

A few ControlCenter utilities have no zPulse equivalent today, for example Balancing Datacenter, K-SET Oracle detection and the SLS report reader. EATC, EADO and RTD z/OS are not part of zPulse either. Tell us which ones you use.

Already an EADM, EATM or EAMC customer? See how to migrate

Four modules

Disk, tape, CPU and space.

The dashboard of a study has up to 40 report screens: 16 for DASD, 8 for CPU, 10 for WLM and 6 for DCOLLECT. Space is the set of DCOLLECT studies. Each module has its own page, with the reports it produces and the files it reads.

Disk deep-dive: from a slow volume to its SSID0:30 · No sound · SubtitledFind the volumes that stand out, split their response time into its components, and follow their LCU to SSID and extent pool. The transcript follows the video.
Transcript: Disk deep-dive: from a slow volume to its SSID
  1. 0:00The average looks fine. Which volumes stand out? [Average Summary for LPAR SYSE: average response time 0.25 ms in TP.]
  2. 0:02Hot Device lists the slow volumes. [Hot Device 3390-XX: I/O > 1, Resp > 1, 602 volume-intervals.]
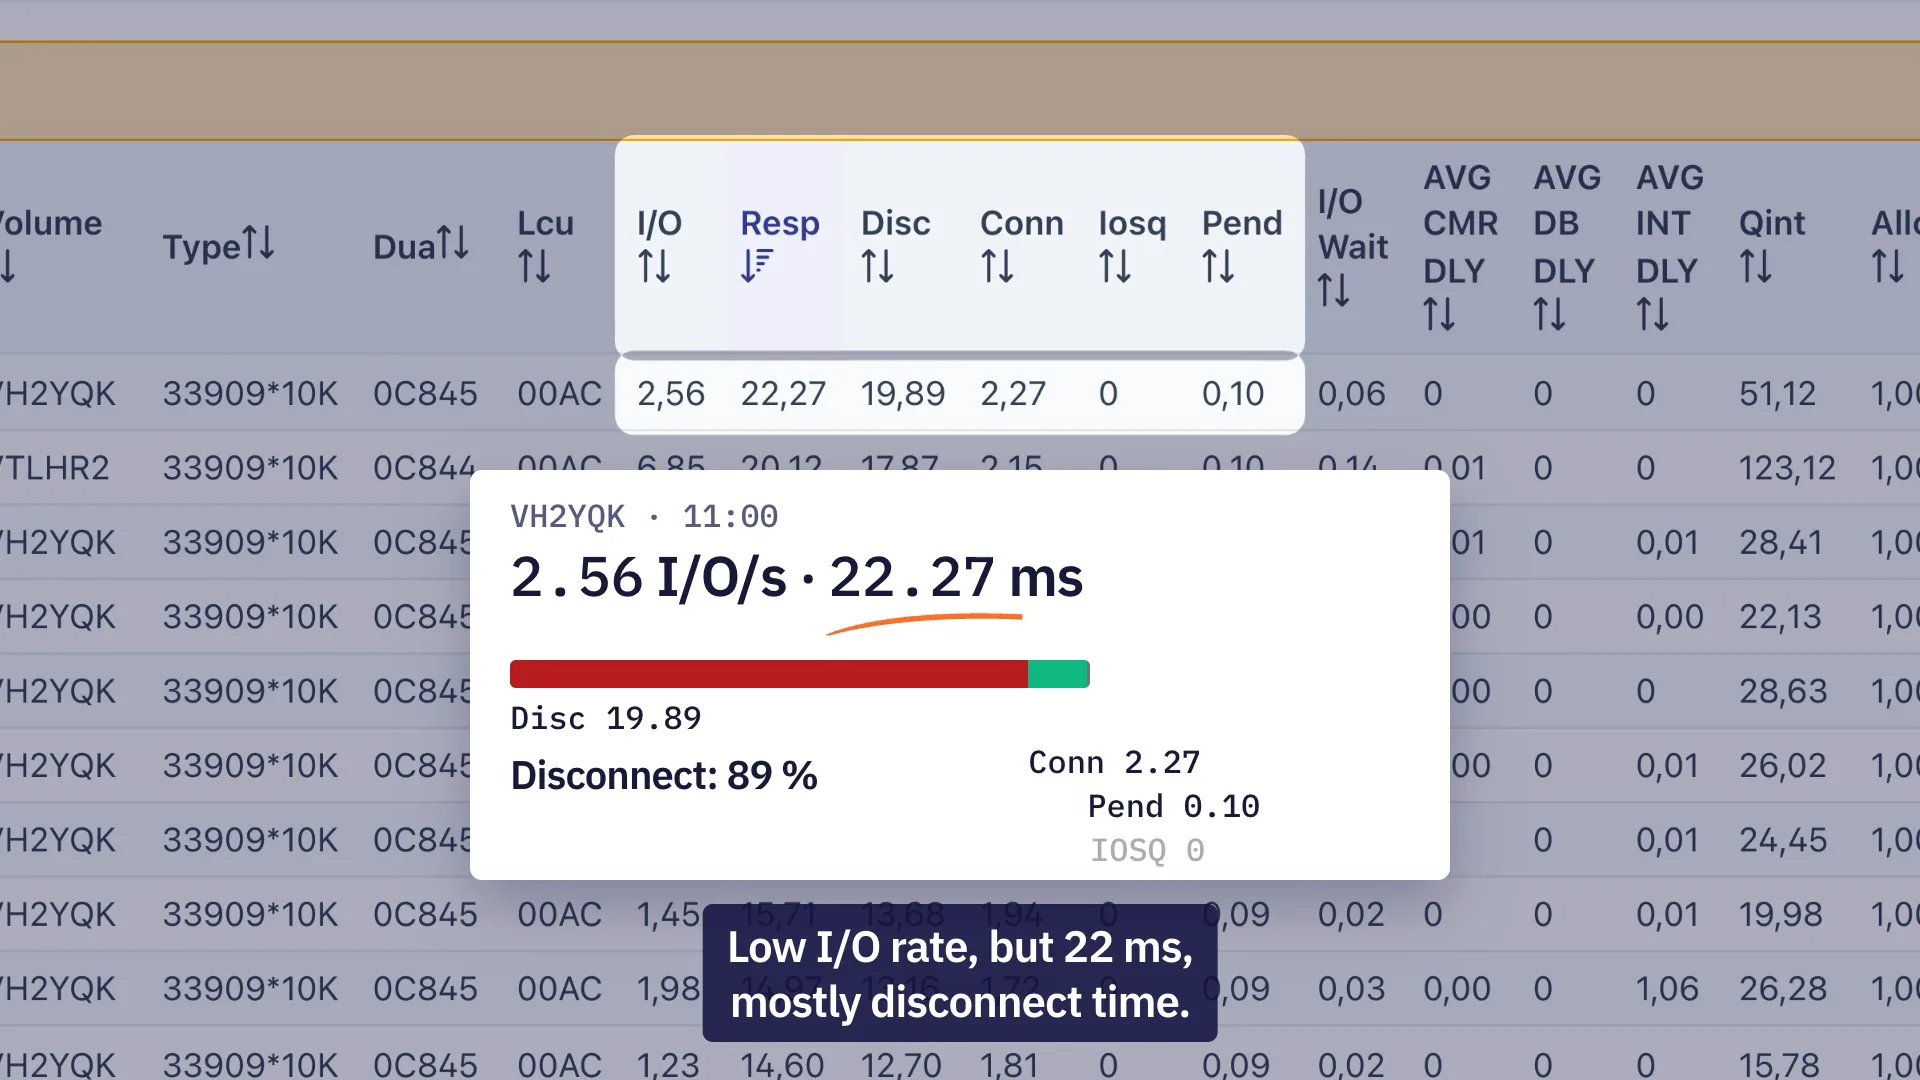
  3. 0:05Sort by Resp: the slowest first. [Sorted by response time, volume VH2YQK comes first.]
  4. 0:08Low I/O rate, but 22 ms, mostly disconnect time. [VH2YQK: 2.56 I/O per second, response time 22.27 ms: disconnect 19.89, connect 2.27, pending 0.10, IOSQ 0. Disconnect is 89 %.]
  5. 0:11Same volume, all morning long. [VH2YQK fills almost every top row, morning and early afternoon.]
  6. 0:13It sits behind LCU 00AC. [Storage group SGQHN4H, LCU 00AC.]
  7. 0:15I/O Topology Flow follows the path: storage group, LCU, SSID, pool. [The flow diagram highlights SGQHN4H, LCU 00AC, SSID C802 and extent pool HHJY9 pool 0000.]
  8. 0:22From a slow volume to its SSID. [Summary: VH2YQK, 2.56 I/O per second, 22.27 ms; disconnect 89 %; LCU 00AC to SSID C802.]
  9. 0:27Get a free study of your own data. technical-storage.com
Tape: virtual tape I/O, mounts and daily mails0:24 · No sound · SubtitledThe tape side of zPulse: virtual tape I/O and mounts from RMF or CMF reports, tape catalogue studies and daily tape mails. The transcript follows the video.
Transcript: Tape: virtual tape I/O, mounts and daily mails
  1. 0:00Five tape tools in the catalogue. [The Tools page filtered on Tape: VEHSTATS Report, Virtual Tape I/O Performance, Tape Mounts VTS, Tape Management Xlsx, TS AddInfo EATM.]
  2. 0:02Drop the same RMF or CMF report. [A CMF file goes into Virtual Tape I/O Performance.]
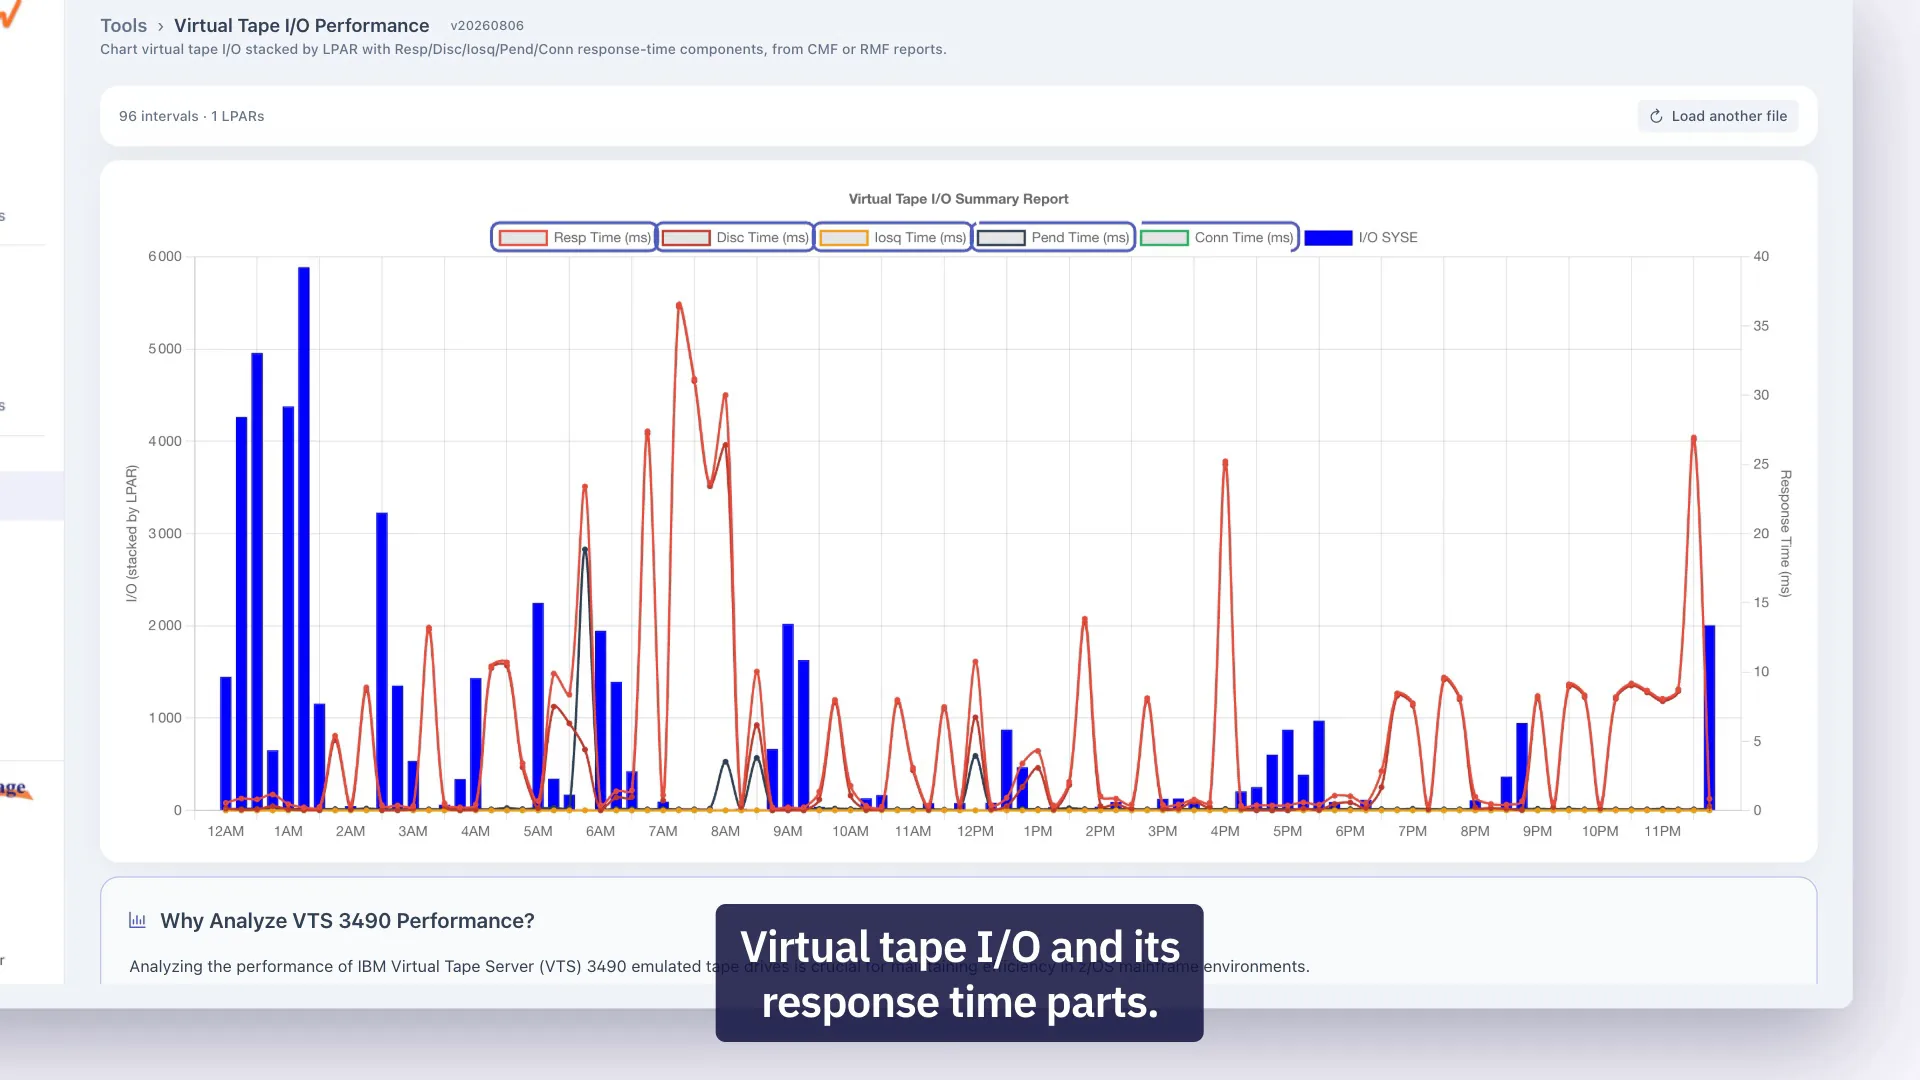
  3. 0:05Virtual tape I/O and its response time parts. [96 intervals, one LPAR (SYSE): tape I/O bars with response, disconnect, IOSQ, pending and connect times; 5,885.58 I/O at 1:15 a.m.]
  4. 0:10Virtual tape mounts over the day. [Tape Mounts VTS, device type 3490L: 123 mounts at 12:30 a.m.]
  5. 0:13Catalogue studies: RMM, CONTROL-T/M and CA-1. [The tape study dialog: Capacity Config and catalogue file.]
  6. 0:16Daily tape mails: Standard report, tape performance and VEHSTATS. [The tape schedule form: Standard report email, Tape perf email & AddInfo, VEHSTATS email.]
  7. 0:21Get a free study of your own data. technical-storage.com

Manual and scheduled studies

Run a study by hand, or schedule it.

A study reads your files and opens a dashboard of report screens. You can drop .txt, .zip or .rar files in a new study, or schedule it to run every day on a folder.

  • SINGLE

    One file

    A study on a single file. The simplest way to look at one set of reports.

  • ACCUM

    Several files added up

    Several files in one study, such as several days or the LPARs of a sysplex, with aggregated reports and a day-by-day axis.

  • COMPARE

    Two files side by side

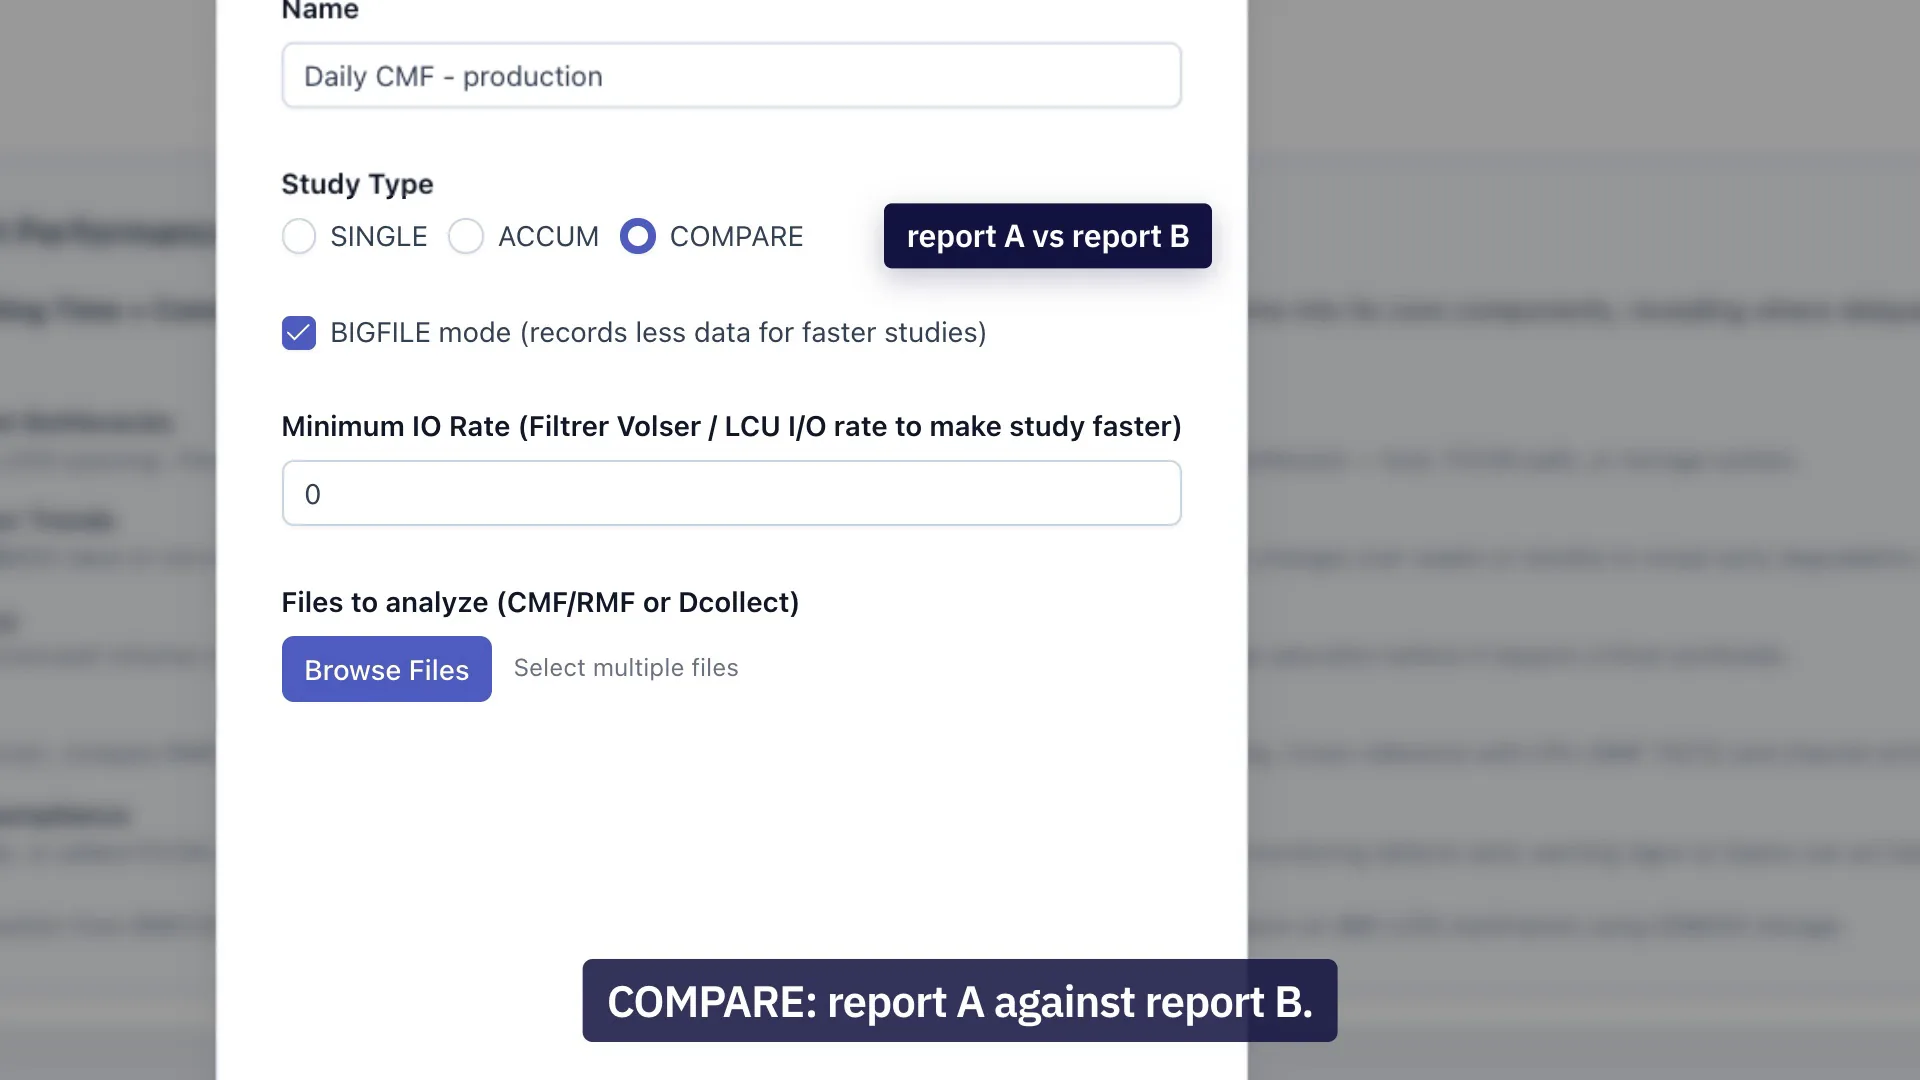
    Exactly two files, A and B, compared on a common HH:mm axis.

  • Export

    PDF and CSV

    A disk study downloads as a PDF of charts with the worst-volume tables. The charts export their data as CSV.

Scheduled studies

  • Every day, at a time you chooseA name, a first run date, a time of day and a source folder. The study runs every day on the server's clock.
  • A source folder in, a report folder outNew .txt, .zip or .rar files in the source folder are analysed. The results are written to the report folder: AddInfo files, a PDF of charts and CSV files.
  • Runs you can followActive or inactive status, the last result (SUCCESS, WARNING or ERROR), a manual launch, and export and import of the configuration. A run delayed by a long study is caught up.
  • A purge only after a backupThe source folder can be emptied after a run, but only once it has been archived.

The results of a scheduled study are files and mails. The application shows its configuration and its status, not a results dashboard. A study is scheduled once a day, at one time.
A study, from reports to dashboard0:30 · No sound · SubtitledCreate a SINGLE, ACCUM or COMPARE study from RMF, CMF or a DCOLLECT extract, open its dashboard, or schedule it to run every day. The transcript follows the video.
Transcript: A study, from reports to dashboard
  1. 0:00A study starts from your reports: CMF, RMF or a DCOLLECT extract. [The list of manual studies shows a DCOLLECT, an RMF and a CMF study.]
  2. 0:04SINGLE: one report. [The Create Study dialog, study type SINGLE.]
  3. 0:06ACCUM: several reports, added up. [Study type ACCUM: select multiple files.]
  4. 0:08COMPARE: report A against report B. [Study type COMPARE.]
  5. 0:10Start the analysis. [Start Analyze, analysis in progress.]
  6. 0:12Disk, CPU and WLM, screen by screen. [The study dashboard: Hot Device 3390-XX, R4HA MSU, Worst QI Periods.]
  7. 0:15Or schedule it. Runs every day at a time you choose. [Create a new Schedule: Daily DASD report, first run 2026-10-08, daily run time 08:00.]
  8. 0:19It reads a source folder and writes to a report folder. [Source path D:\zPulse\incoming, report path D:\zPulse\reports; every day at 08:00 the study reads the folder, writes 3 file sets and a charts PDF, and sends 1 email to storage-team@example.com.]
  9. 0:23Report files, a charts PDF, and optional daily mails. [CPU/MSU, DASD performance and DCOLLECT files, charts PDF; DASD AddInfo, DCOLLECT and CPU MSU emails.]
  10. 0:27Get a free study of your own data. technical-storage.com

The daily mail

The study is in your mailbox before the morning meeting.

Each scheduled study can send mails by Report Family. The charts are in the body of the mail, with no attachment, and the period covered is in the subject.

  • Disk

    DASD AddInfo

    I/O and response time components by time slot, a worst-volume table, sections per filter (LPAR, VOLSER, STOGROUP, LCU), and native, hourly or daily granularity.

    • History up to 60 days
  • CPU

    CPU MSU

    One mail per configuration and time slot, with three charts per LPAR: average MSU, sum of MSU and maximum R4HA.

    • History up to 60 days
  • Space

    DCOLLECT

    Allocated and free space by LPAR, allocated space against fragmentation index per volume, and an optional table of the 20 worst volumes.

  • Tape

    Standard report

    Active and scratch volumes and capacity in GB, by tape type. It is not sent when there is no new catalogue file.

  • Tape

    Tape performance

    Tape I/O stacked by LPAR and response time components, with an LPAR filter and native, hourly or daily granularity, from RMF or CMF.

  • Tape

    VEHSTATS

    CPU, disk, TVC cache and other charts for each TS7700 cluster, with an optional aggregated cluster.
  • You choose the recipientsTo, Cc and Bcc, a free subject and body, and a footer. The mail leaves through your own SMTP server.
  • The period is in the subjectThe default subject reads zPulse, the Report Family, the study and the period covered.
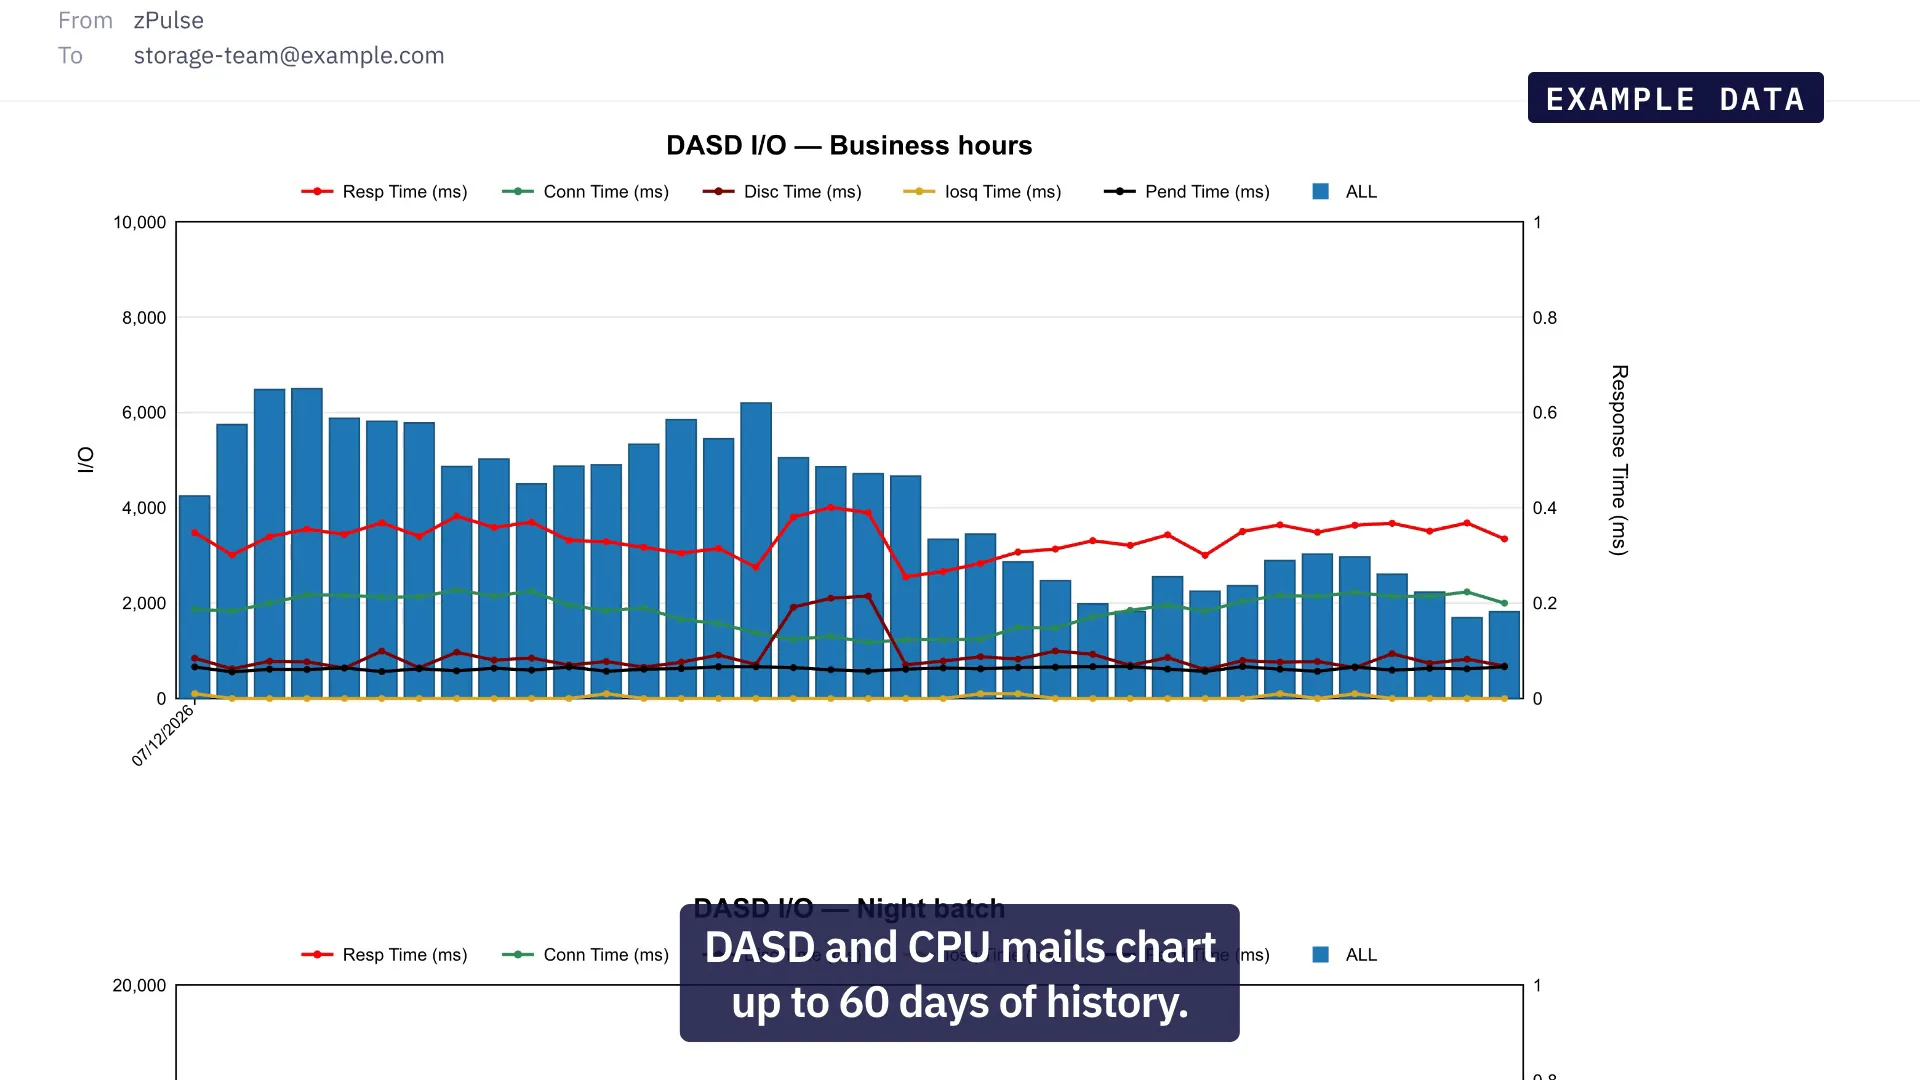
  • History in two of the mailsThe DASD and CPU mails chart up to 60 previous days, from files kept in the report folder. The history starts at the first run. The other mails chart the current run.
  • One failure stays isolatedIf one Report Family fails, the other mails of the run still go out.
The morning mail0:28 · No sound · SubtitledDisk and tape schedules send their Report Families by mail every day: the period in the subject, charts in the body, up to 60 days of history for DASD and CPU. The transcript follows the video.
Transcript: The morning mail
  1. 0:00Every day, at a time you choose… [A scheduled study runs every day at the time set in its form.]
  2. 0:02…pick your Report Families: disk, CPU, space, tape, VEHSTATS. [Disk and tape schedules offer six Report Families: DASD AddInfo, CPU MSU and DCOLLECT in the disk schedule; Standard report, Tape performance and VEHSTATS in the tape schedule.]
  3. 0:08The study is in your mailbox… [Example data: a mail arrives, "zPulse DASD AddInfo Report — Daily DASD report — 7 Dec 2026".]
  4. 0:10…before the morning meeting.
  5. 0:12The period is in the subject. [The mail starts with Period: 7 Dec 2026.]
  6. 0:15DASD and CPU mails chart up to 60 days of history. [Example data: DASD I/O chart for business hours, then the last 60 days.]
  7. 0:19Worst volumes, right in the mail. [Example data: table of worst volumes by response time.]
  8. 0:22Charts in the body. No attachment.
  9. 0:25Get a free study of your own data. technical-storage.com
Example data
From zPulse · 06:02zPulse DASD AddInfo Report — Daily DASD report — 7 Oct 2026

I/O response time by hour (ms), stacked by component

0.00.20.40.600:0006:0012:0018:00
  • Conn
  • Disc
  • Pend
  • IOSQ
  • Resp

Previous days: average response time (ms)

0.00.30.630 days agoyesterday

The mail charts up to 60 previous days.

Worst volumes
VolumeResp (ms)IOSQ (ms)
DB2L030.610.12
DB2L070.520.09
PRD1040.470.04

Period: 7 Oct 2026 · Charts are in the body of the mail, with no attachment.

Tools

25 tools, from the TS ControlCenter and new.

Open a report or a folder in a tool and get charts and tables on one subject: channels, cache, mounts, MSU, space. Here are eight. The catalogue lists all 25, with the file each one reads.

Four of the 25 prepare or load data: TS Cleaner, TS LPAR Anonymizer and the two DCOLLECT imports. Nine need files written by a scheduled study, or by the former EADM, EATM or EAMC. Each card of the catalogue says which.

See the 25 tools

Optional local AI

A written diagnostic of your disk studies, on your server.

For scheduled disk studies, a statistical engine computes signals from your DASD data, and a small language model running on your server turns them into sentences.

  • A verdict with its evidenceOK, WATCH or RISK, with the evidence, the anomalies and the points to check. A second text names the most likely cause, the problem volumes and recommended actions.
  • Signals computed, not guessedBaselines over 28 days, robust z-scores, the p95 trend, capacity drift and the zHPF share are computed by a statistical engine. It sets the severity, not the model.
  • Local onlyThe model runs on Ollama, on the same server. Nothing leaves the machine. Without Ollama the AI step is skipped and studies run as usual.
  • A text file in the report folderThe diagnostic is written as text files in the AiInfo folder of the report path. It is not shown on screen and not attached to the mails.

What it is not: it covers scheduled disk studies only, Ollama and the model are installed separately, and the model has 4 billion parameters. It rephrases computed signals. It does not correlate across LPARs, and it does not replace an expert.
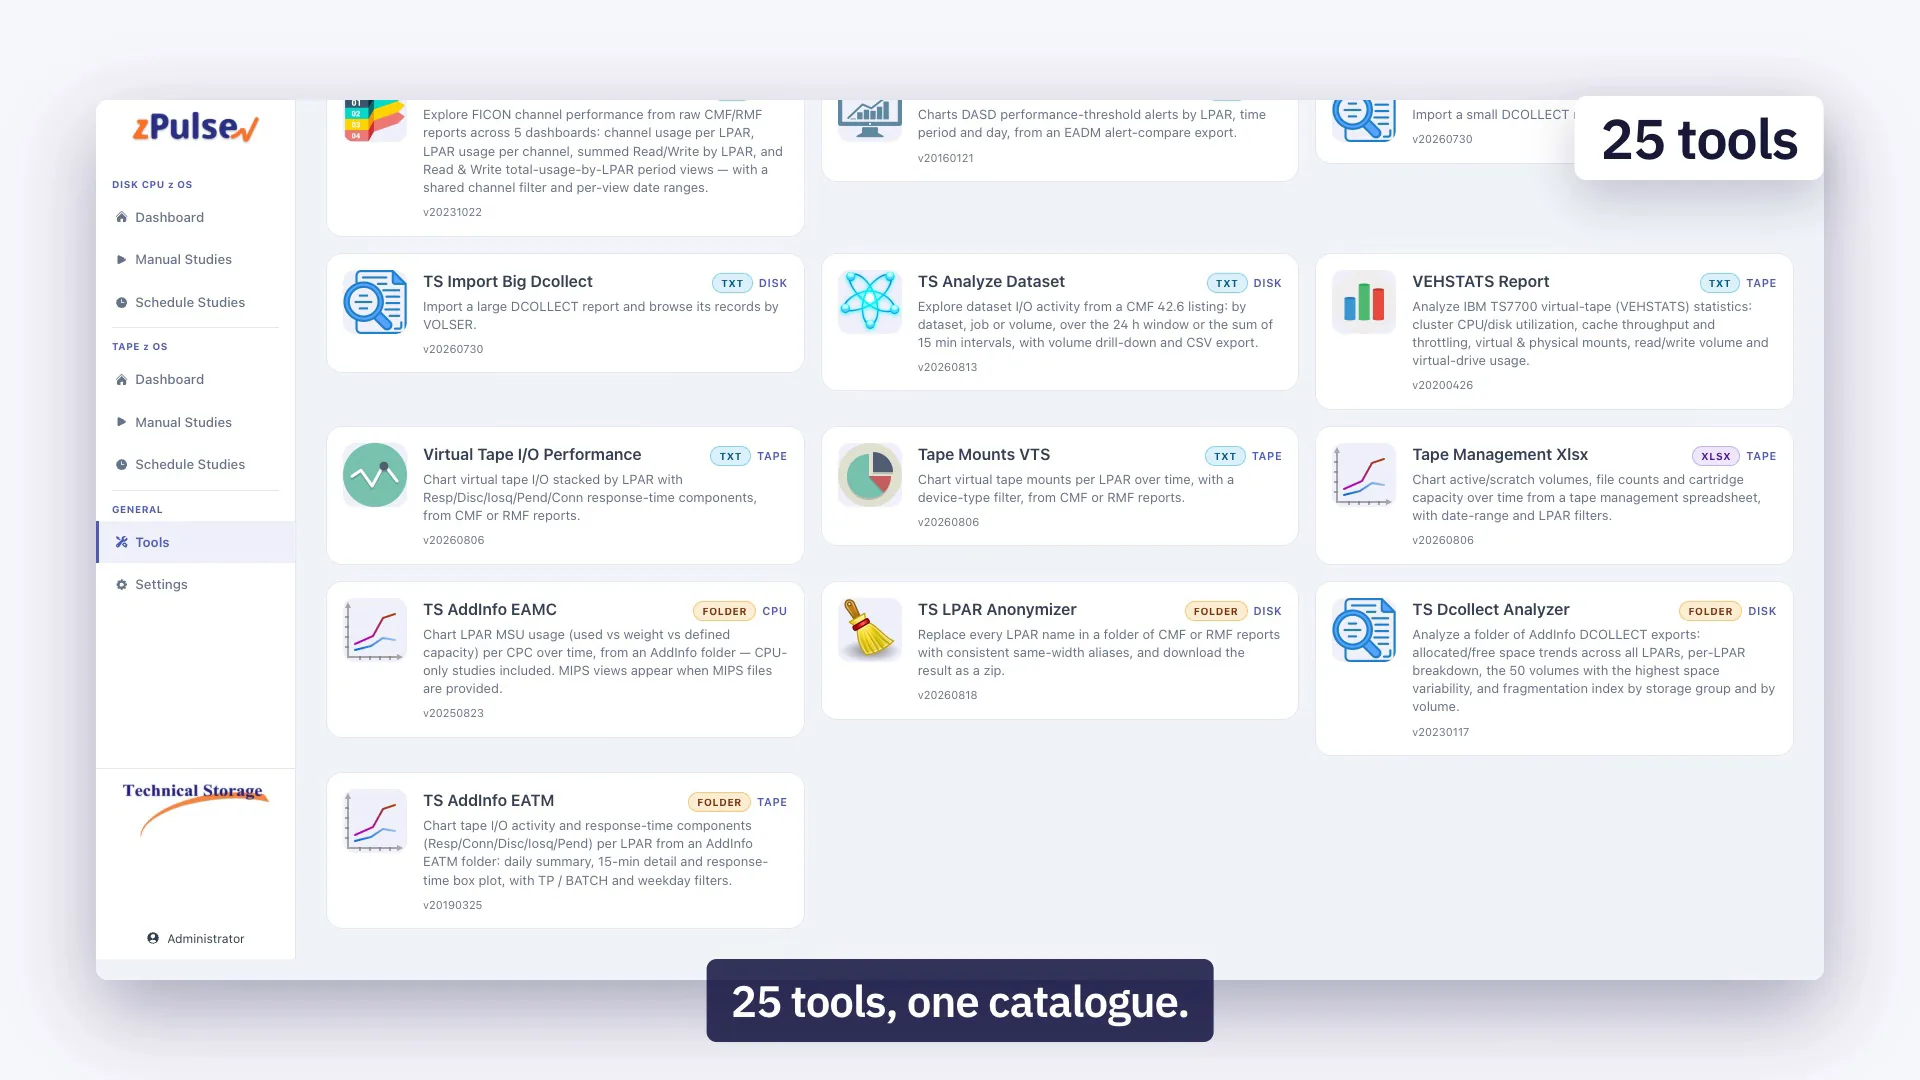
25 tools and an optional local AI0:30 · No sound · SubtitledA tour of the 25 zPulse tools, then the optional local AI summary of scheduled disk studies, written to a text file on your server. Optional, separate local AI install. The transcript follows the video.
Transcript: 25 tools and an optional local AI
  1. 0:0025 tools, one catalogue. [The zPulse Tools page with 25 tool cards.]
  2. 0:02Filter by Disk, Tape or CPU, or just search. [Filters Tape and CPU, then a search for "ficon" returns three tools.]
  3. 0:06Drop a CMF or RMF report… and read LCU open exchange. [TS Open Exchange on an RMF report: LCU Activity, then Channel Activity.]
  4. 0:10Map LCUs and SSIDs to volumes. [TS LCU SSID Association: chart per LCU, chart per SSID, LCU 002C with its volsers.]
  5. 0:13Optional: a local AI summary of your scheduled disk studies. [In the schedule form, DASD performance files include the AI diagnostic in an AiInfo folder when the local AI engine is available. Optional, separate local AI install.]
  6. 0:17It writes a plain text file next to the study reports. [Example output: IA-diagnostic.txt with Overall: WATCH, key evidence, what looks abnormal, what to verify next.]
  7. 0:21The model runs on your server. No data leaves your machine. [Ollama on localhost. Optional, separate local AI install.]
  8. 0:27Get a free study of your own data. technical-storage.com

Installation and security

Installed on your server. Your data does not leave.

zPulse is installed on your premises. There is nothing to install on z/OS.

  • Windows server and PostgreSQL

    An installer sets zPulse up as a Windows service that runs around the clock, so scheduled studies start on time. PostgreSQL is installed first. Windows only: there is no Linux or macOS version.

  • Browser or desktop application

    Open the same interface in a browser on the server, which listens on the server itself by default, or in the portable desktop application, which guides the first launch.

  • Offline licence activation

    A request code tied to one machine, an activation code in return. The server needs no internet access. Trial, annual and lifetime licences exist. Support and training come with the licence.

  • Nothing leaves your server

    zPulse sends no telemetry. The only outgoing traffic is the mail it sends through your own SMTP server and, if you enable the AI, calls to Ollama on the same machine.

FAQ

Questions from storage managers

What data does zPulse read?

RMF and CMF reports as text files, DCOLLECT extracts, tape catalogues (DFSMSrmm, CONTROL-T/M and CA-1) and TS7700 VEHSTATS files. You can drop .txt, .zip and .rar files. Nothing is installed on z/OS.

Does zPulse read raw SMF?

No. zPulse reads the printed RMF and CMF reports, which you produce from SMF with your usual jobs. It has no raw SMF parser.

Can zPulse read my DCOLLECT data directly?

It reads a text extract of DCOLLECT data with columns separated by semicolons, not the raw DCOLLECT file. The defrag report also needs the FREXT and FTRKS columns. Ask us for the extraction procedure.

What does the installation involve?

A Windows server and a PostgreSQL database. The installer sets zPulse up as a Windows service, and you open the interface in a browser on the server or in the desktop application. There is no Linux or macOS version today.

Where does my data go?

Nowhere. zPulse runs on your server and sends no telemetry. The only outgoing traffic is the mail sent through your own SMTP server and, if you use the optional AI, calls to Ollama on the same machine.

How does the licence work?

Activation is offline and tied to one machine: you send a request code and get an activation code back. Trial, annual and lifetime licences exist.

I use EADM, EATM or EAMC. Can I move to zPulse?

Yes. Disk, Tape and CPU carry the analyses of the three products, and zPulse reads the same kind of RMF and CMF reports. The zPulse history starts at its first run. MIPS views need MIPS files written by EAMC. See the migration page for the steps.

How long does a study take?

It depends on the size of your report files and on your server, so we do not quote a fixed time. Scheduled studies run unattended at the time you choose.

Does the AI diagnostic send my data anywhere?

No. It is optional and runs on Ollama on the same server. It covers scheduled disk studies, writes a text file in the report folder, and does not replace an expert.

Can I try zPulse before I buy?

Yes, with a free study: send us an extract and a Technical Storage expert runs it through zPulse and walks you through the results. Trial licences also exist; ask us about the terms.

Get a free study of your own data

Send us an extract. A Technical Storage expert runs it through zPulse and walks you through the results.

zPulse is what Technical Storage built to do its own studies, after thirty years of z/OS storage work. An expert reads the results with you when you want a second opinion. How we work with you